
logo
AXIS CORRELATION
ADM AGILE DIE MANAGEMENT

Visual Comparison Creates Engineering Insight

< 1 min read

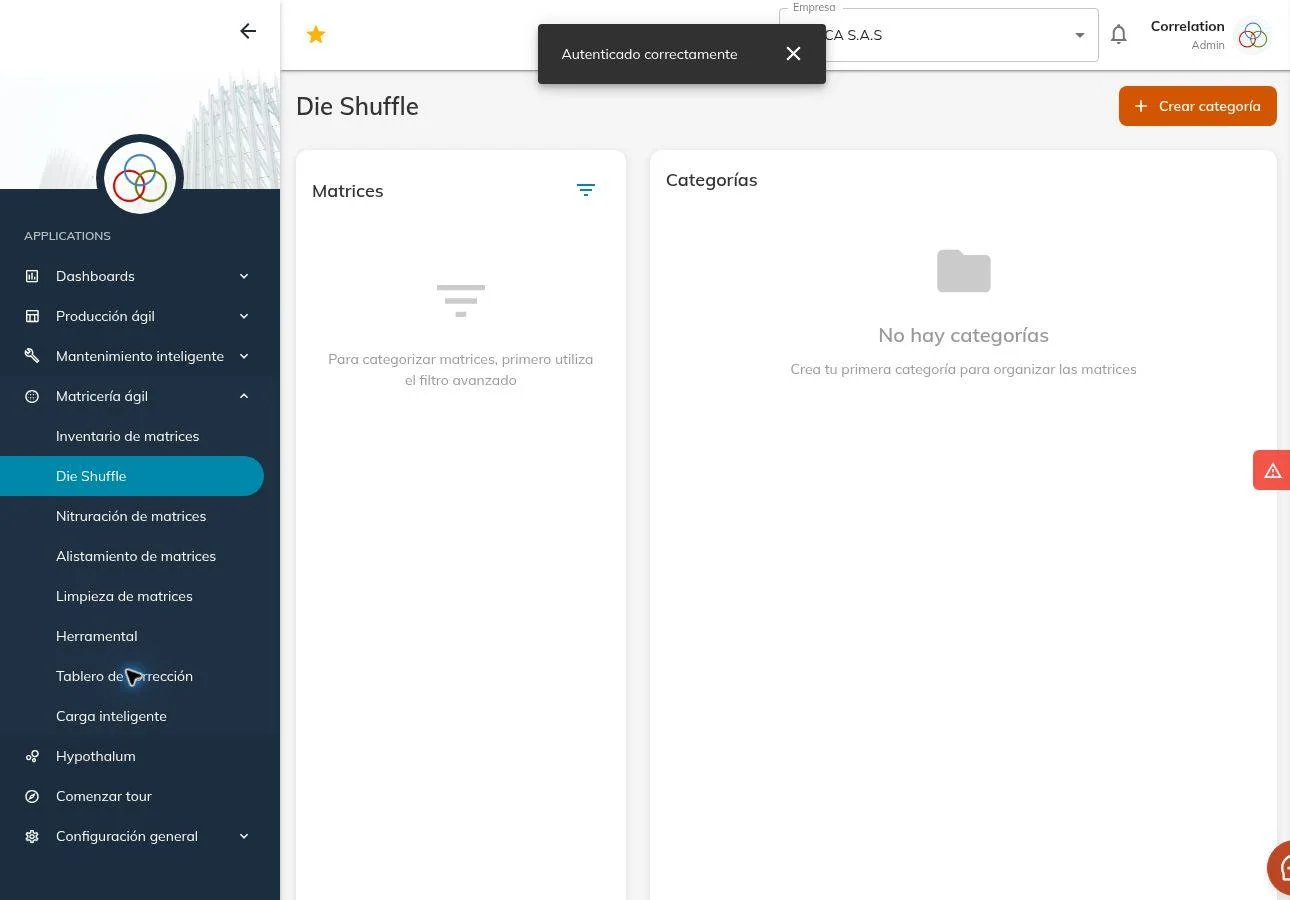
Die Shuffle overview with tooling populations organized into comparison categories.
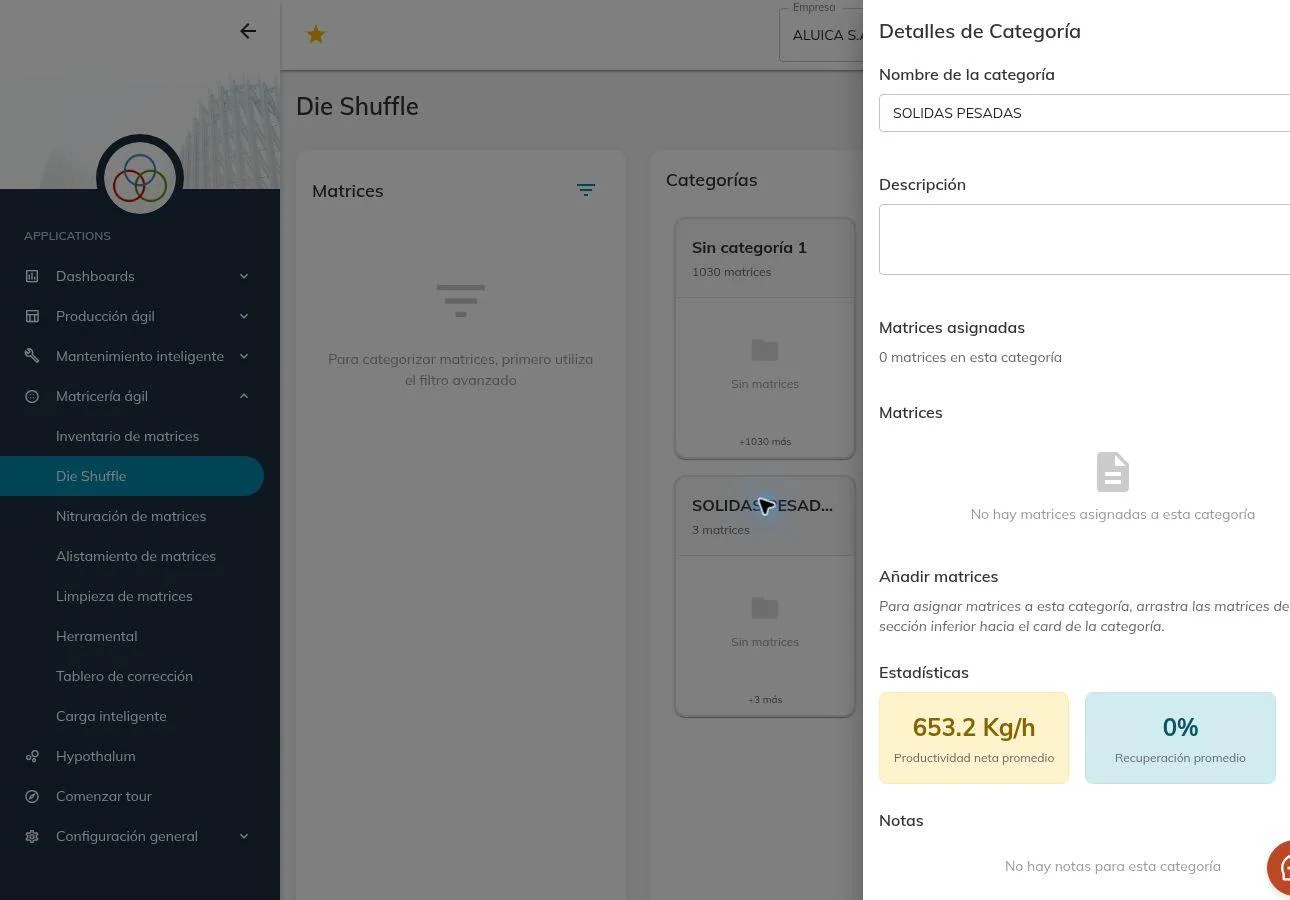
Category detail with engineering statistics for a selected tooling population.
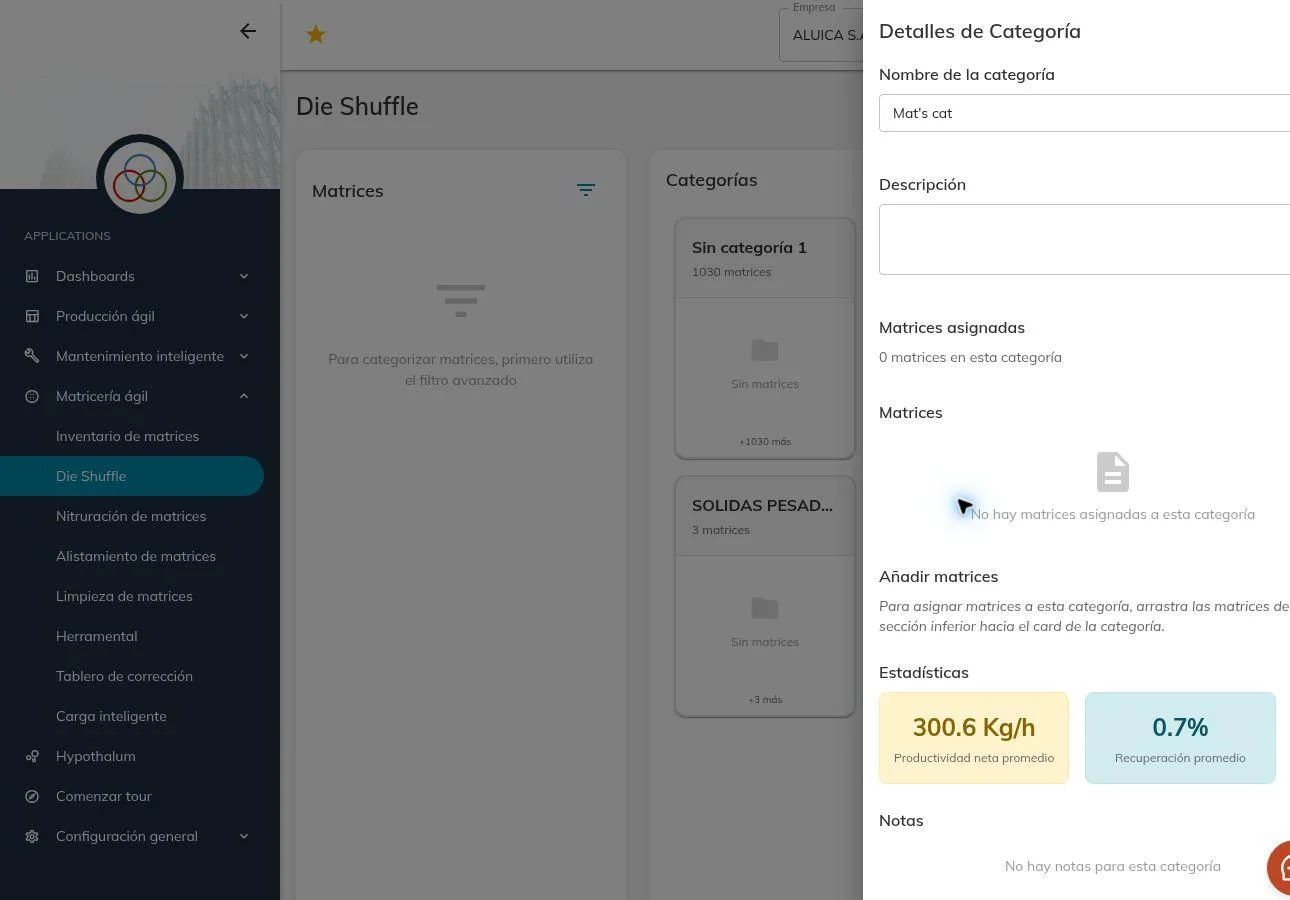
Second category view showing comparative productivity and recovery measures.
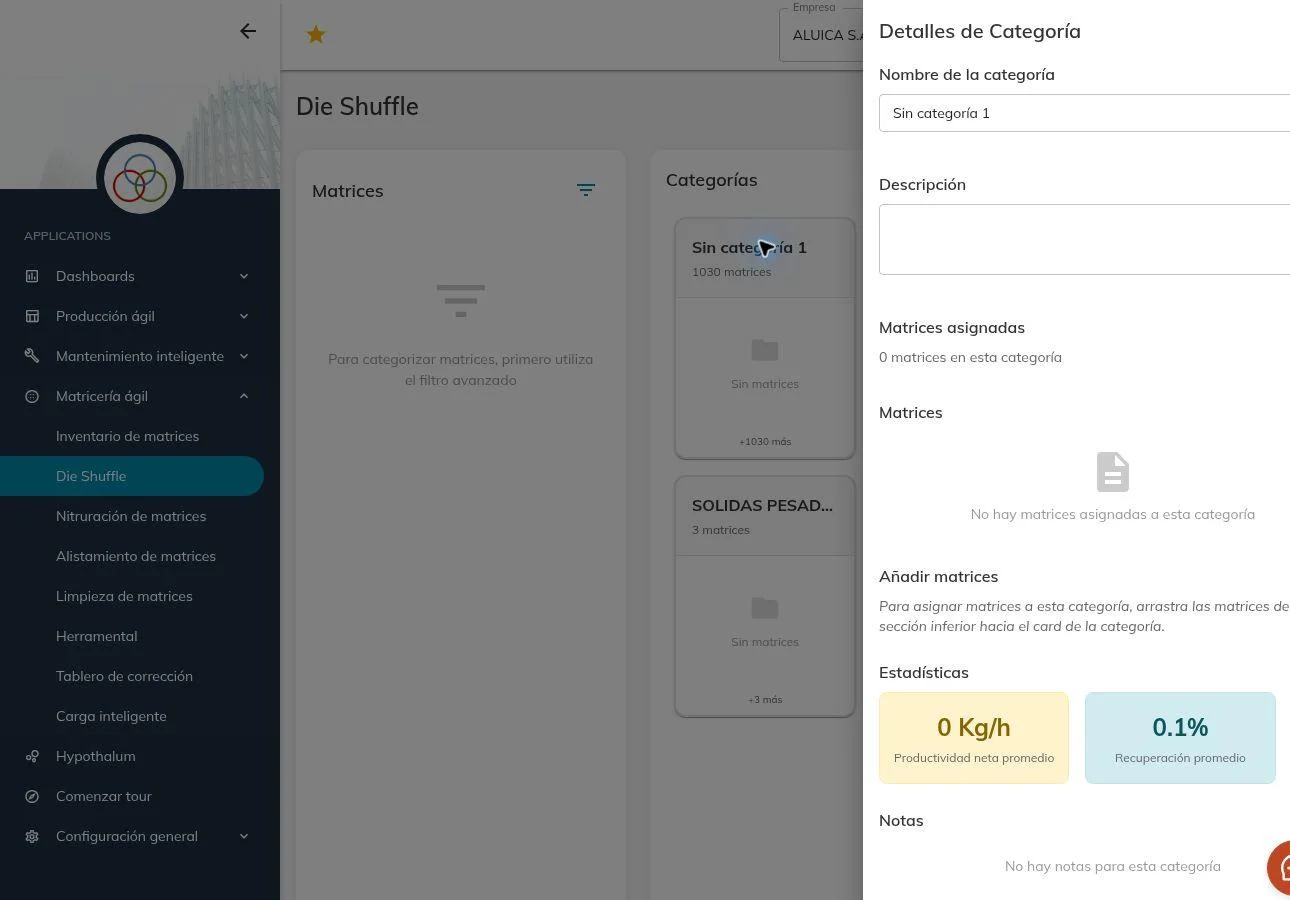
Population detail for a larger tooling group within Die Shuffle.
Advanced filtering interface for finding and comparing structured tooling information.

The visual nature of Die Shuffle is especially important.

Traditional manufacturing databases often reduce tooling to rows of text.

Those fields are important, but they remove much of the context that engineers use when they think about profiles.

Two dies may have different part numbers and different customers while sharing nearly identical geometric characteristics.

An experienced engineer may immediately recognize that similarity.

A traditional database may not.

Die Shuffle brings those visual relationships back into the analysis.

By placing the shape itself at the center of the framework, engineers can identify patterns that would be difficult to discover using text-based searches alone.

Shape becomes another form of metadata.

And once shape, dimensional characteristics, and production performance can all be compared together, the tooling population becomes a much richer engineering dataset.

Updated on August 14, 2026

What are your feelings

  • Happy
  • Normal
  • Sad